Financial Models for Growing Businesses

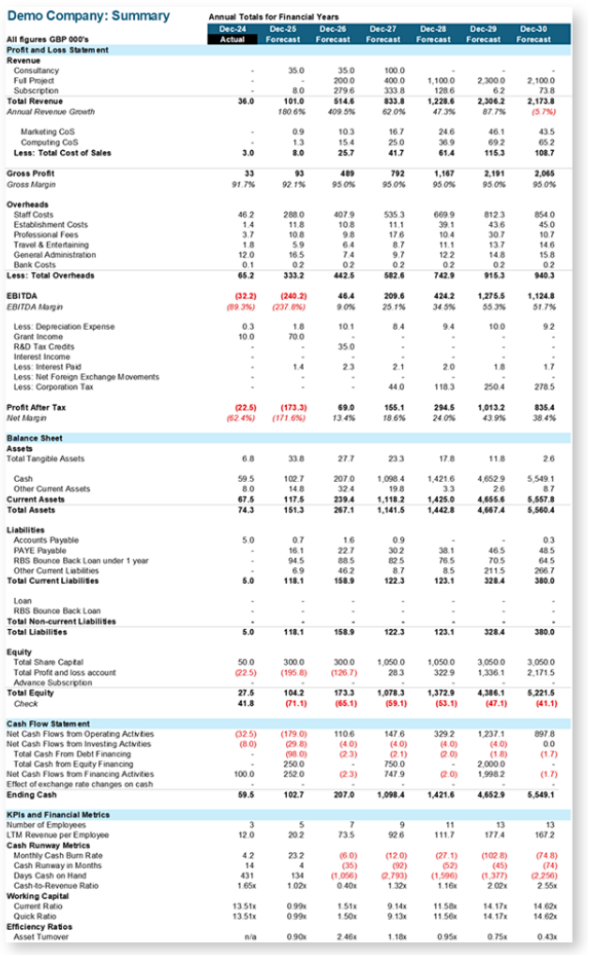
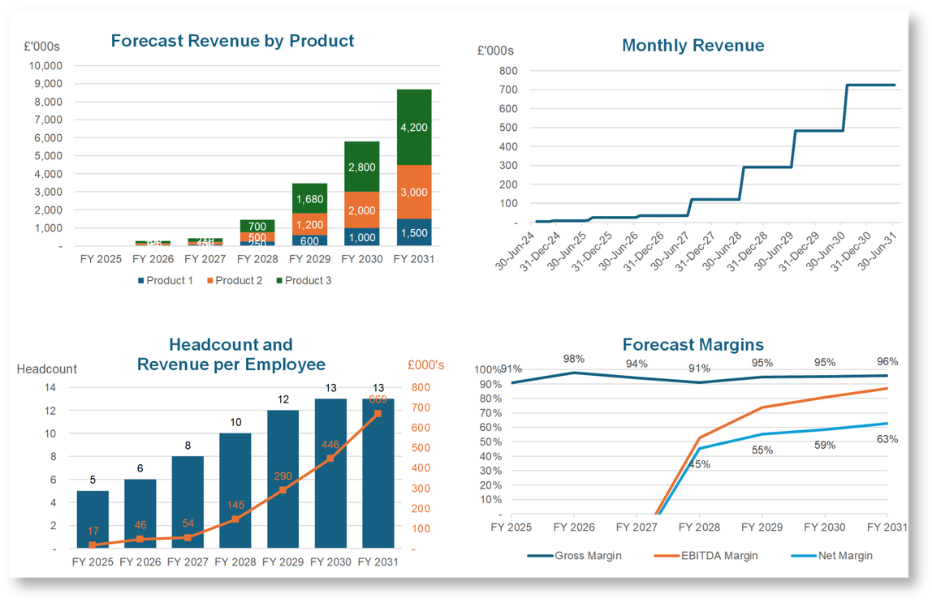
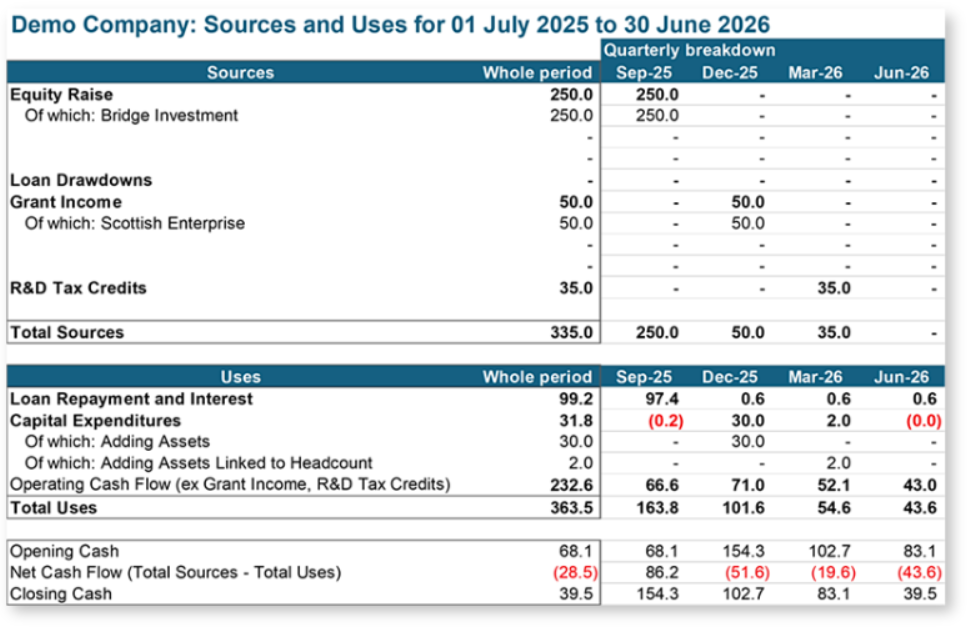
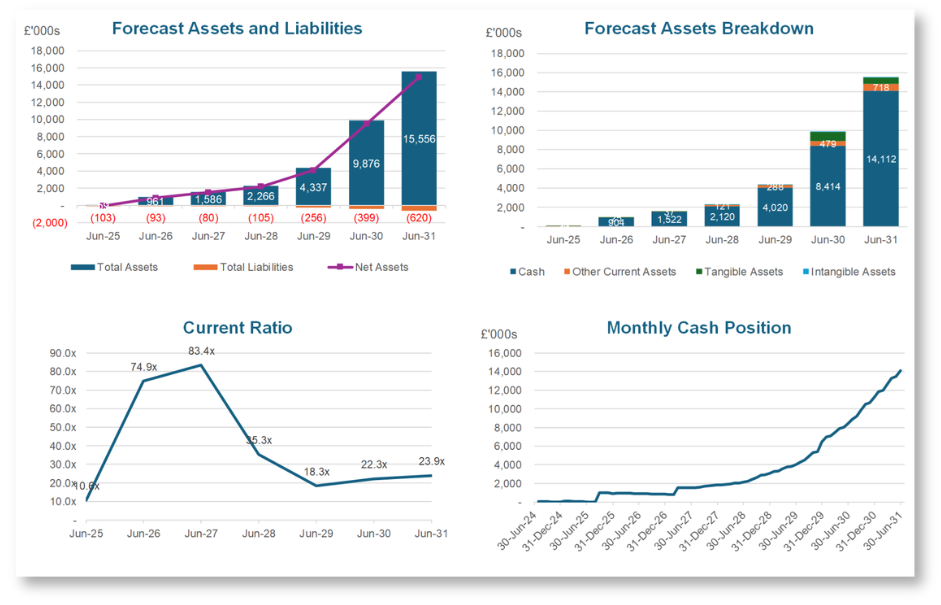
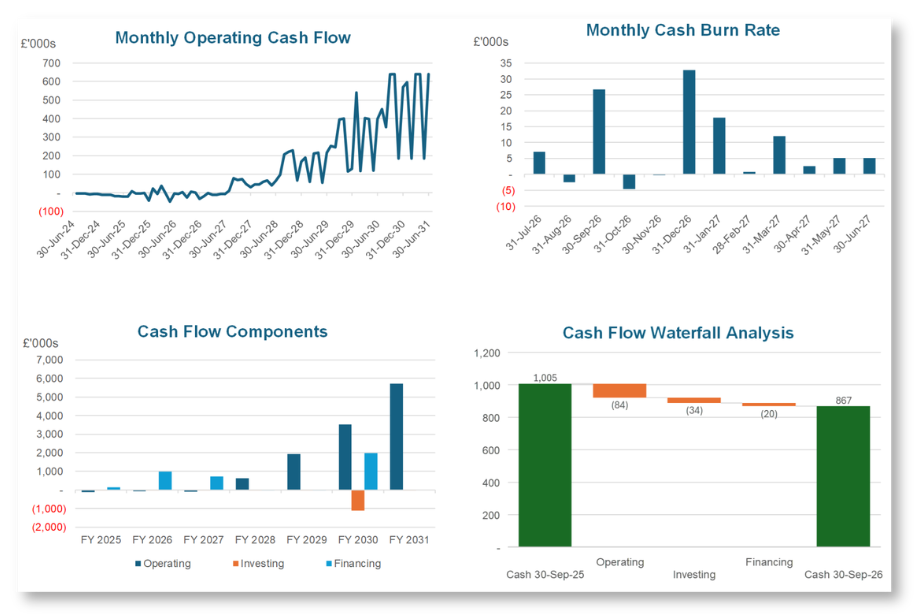
Get investor-ready financial projections that tell your story with confidence. Whether you're preparing for fundraising, planning your growth, or managing cash flow, I build models that give you the clarity and credibility you need.

Customized to your business

Built from scratch or adapted from proven templates to match your specific industry, business model, and stage of growth.

Financial spreadsheet displaying sources and uses for July 2025 to June 2026, including equity raise, loan drawdowns, grant income, tax credits, and cash flow analysis with quarterly breakdowns.
Financial charts comparing assets and liabilities, assets breakdown, current ratio, and monthly cash burn rate from fiscal year 2024 to 2030.

Designed for founders, not just finance professionals

So intuitive you'll confidently update forecasts and run scenarios without needing ongoing support (though I'm always available if you need help).

Flowchart illustrating the financial model calculation process, showing input worksheets for sales, people, funding, other assumptions, and historical actuals leading into a model, which then produces output worksheets including summary, charts, sources and uses, and scenario comparison.

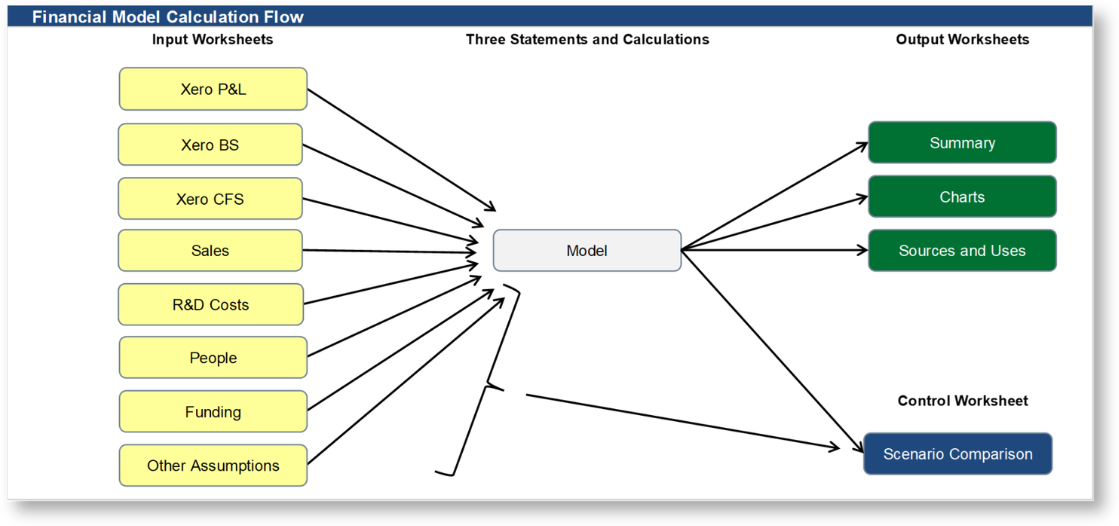
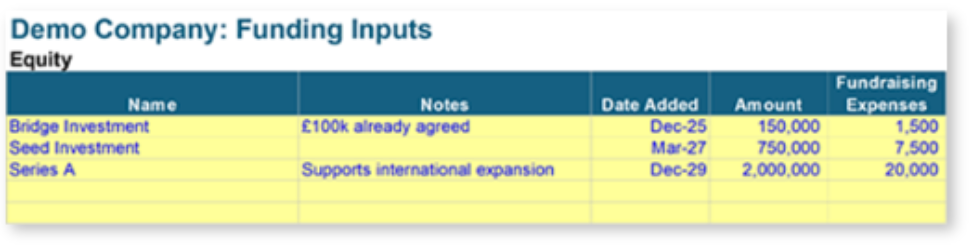
Seamless integration

Simply paste exports from your accounting system to update actuals.

Four financial charts showing cash flow components, cash flow over time, waterfall analysis, and monthly cash position with data from 2024 to 2030.
Table titled 'Demo Company: Funding Inputs' listing investment details: Bridge Investment, Seed Investment, Series A with notes, dates, amounts, and expenses.

Professional and reliable

Full documentation, built-in error checks, and version comparison tools ensure accuracy when it matters most.

Summary table of financial data for a demo company, including revenue, gross profit, operating costs, EBITDA, net income, balance sheet assets and liabilities, equity, cash flow, and KPIs, with actual and forecasted figures from Dec-24 to Dec-30.
Four charts: 'Annual Revenue' showing increasing revenue from FY 2024 to FY 2030; 'Annual Revenue and Cost of Sales' depicting costs; 'Number of Employees and Revenue per Employee' illustrating workforce growth and revenue efficiency; 'Annual Revenue Mix (%)' showing a shift from consultancy to full project and subscription services over years.